Seeing Like A Satellite
Satellite images are a distinct category of digital images. They incorporate additional descriptors beyond what is found in photographs. Satellite images contain spectral information imperceptible to human vision, along with geocoding information. As such, they constitute a particularly densely packed, multi-valued form of spatial representation.
The concept of operational images offers a generative entry point into repositioning remote sensing image artifacts. The artist Harun Farocki coined the term operational images in the early 2000s as he investigated the fluidity of industrial machine vision processes and documented, in video, the making of control systems across industrial processes and autonomous weapon systems, including laser scanning and robotic navigation, where imagery enables downstream operations such as motion control. Farocki’s exploration of enabling/operational images suggested a category of imagery as a kind of signpost of events that cannot be seen, a tracer of processes capturing indirect evidence of what can only be inferred.
While Farocki is likely the source of the term operational images, the significance of operationality in cultural production was recognized earlier. Gilbert Simondon coined the term operational schemes (schèmes opératoires) and understood the concept as integral to scientific thinking. Operational schemes reside in the middle ground between scientific practice and technology. Scientific thinking, according to Simondon, requires operational schemes in order for a technique to emerge. The concept of operational chains (chaîne opératoire), perhaps derived from Simondon’s operational schemes, is attributed to André Leroi-Gourhan.
Satellite sensing is often described according to differences across spatial, radiometric, spectral, and temporal domains. Spatial resolution, or the number of pixels per meter, determines the size of the area seen on the Earth’s surface from a specific altitude. Radiometric resolution defines the sensor’s responsiveness to the strength of incident light energy. Spectral resolution represents the dynamic range of the electromagnetic spectrum that the satellite sensors can capture. Temporal resolution is the amount of time required for a given sensor to see, or revisit, the same area. High-resolution satellite assets typically excel in these four domains. Finally, satellite imagery is typically encoded in a dedicated format, GeoTIFF, that expands the existing TIFF image file structure with geolocation metadata.
Land cover classification relies on analyzing the spectral reflectance of sunlight from the ground as captured from orbit. Different kinds of land cover, ranging from arid desert to humid rainforests, exhibit varying levels of reflectance. These varied reflectance patterns can be considered signatures—unique features associated with the sources of the reflected energy.
Image processing algorithms collect and analyze these signatures as information for land cover classification. When the reflectance signatures are geolocated in the field, they serve as grounding references, enabling an algorithm to associate an actual location on the Earth's surface with its corresponding spectral representation in a satellite image. The combination of spatial, spectral, and temporal information produces a unique, place-based mathematical representation of a particular area of the Earth’s surface. The patterns contained within these representations are a satellite’s view of the landscape.
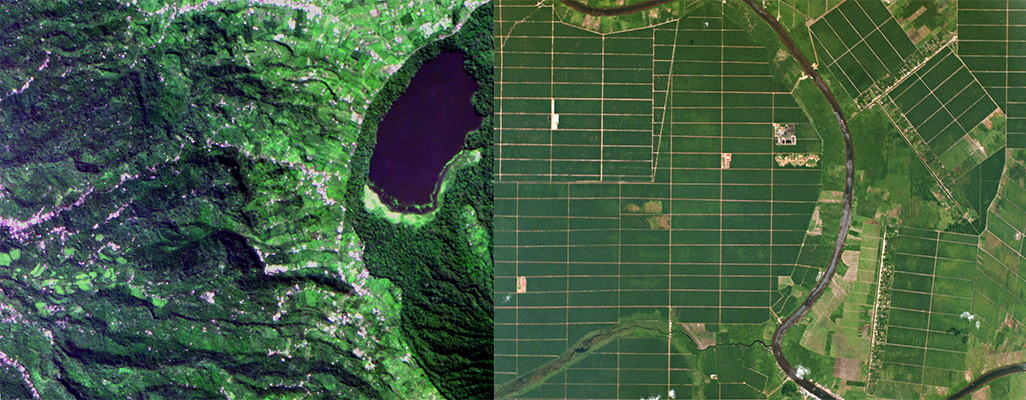
Right: Palm oil plantation, Sumatra, Indonesia. Source: Planet Labs, May 20, 2015. Left: Mixed forest and agroforestry plots in the highlands of the Alas Mertajati. Source: Planet Labs, June 17, 2017. Both images contain 4 spectral bands (red, blue, green, and near-infrared). Both images have a spatial resolution of 3.4 meters/pixel.
The patterns can also capture signatures of human intervention in the landscape. Shown above are two images depicting tropical farmlands. Both images are obtained from the Dove satellite constellation of Planet Labs. The first image showcases a palm plantation in Sumatra, characterized by a large-scale monoculture system designed for efficient palm oil production. In contrast, the farmlands in the highlands of Bali exhibit a more irregular arrangement. The presence of small-scale farming practices and complex land ownership conditions is reflected in the patchwork of greenery across the landscape. Due to the emphasis on small-plot cultivation in hilly terrain, irregularly shaped land plots are the norm. In a climate where plant growth occurs continuously, with plants flowering on a weekly basis, change is a constant factor. The machinery of GeoAI, utilizing pixels and algorithms designed to detect patterns and regularities, seems to be more at home in the rectangular parcels of plantations.
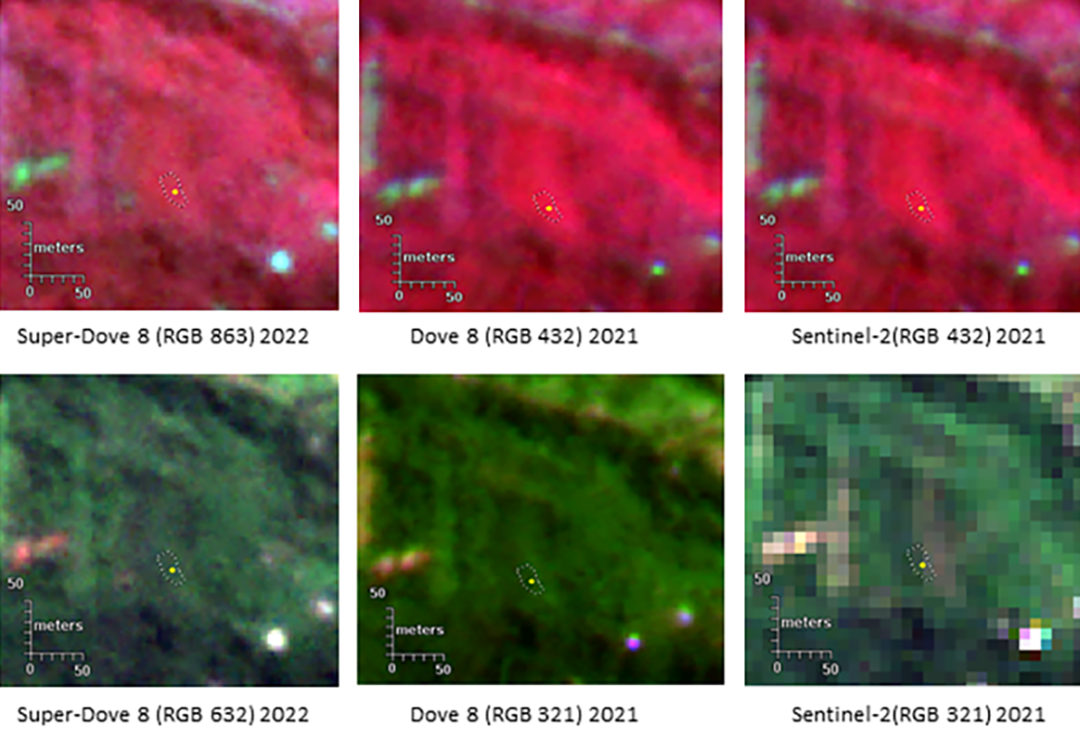
Spatial resolution of satellite assets. False color and true color rendering of the agroforestry site captured by Dove, SuperDove and Sentinel-2 satellites, showing differences in spatial resolution. Focus area (yellow) is an agroforestry site.
The expressive sensing power of an orbital asset is given by the combination of temporal, radiometric, spatial, and spectral resolution, where each satellite system has its own combination of these features. The European Space Agency’s Sentinel-2 satellites have 13 distinct bands, whereas the Planet Labs SuperDove constellation has 8. However, SuperDove has a temporal resolution of 1 day, whereas Sentinel-2 has a temporal resolution of 5 days. While SuperDove has a spatial resolution of 3.4 meters per pixel, Sentinel-2’s bands produce imagery with resolutions ranging from 10 meters to 60 meters. The satellite images above demonstrate how important spatial resolution is for small-scale landscape features. Only satellite assets that deliver sufficient spatial and spectral resolution are suitable for observing small-scale agroforestry plots.
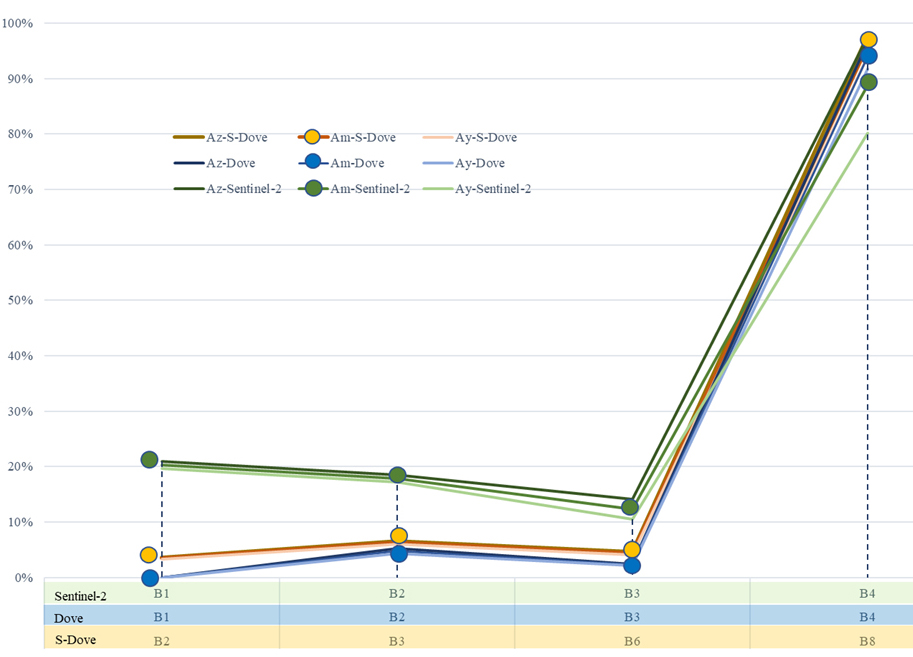
Spectral resolution of satellite assets. Y-axis shows spectral reflectance as a percentage of individual bands from Dove (bands 1-4), SuperDove (bands: 2,3,6,8) and Sentinel-2 satellites (bands 1-4) on an agroforestry plot with coffee arabica as the dominant species. SuperDove's band 8 is particularly effective at detecting the signature of coffee arabica, for example.